Increasing protectionism will slow down world trade and may dampen global economic growth. This column examines the global macroeconomic consequences of a major trade conflict between the US and China, and shows that the two countries would be the biggest losers from a 10% ‘tit-for-tat’ trade war between them. As long as it does not get involved in the conflict, the euro area may temporally gain from trade diversion, as competitiveness improves and imports from regions whose exports are blocked elsewhere become cheaper.
After a decades-long gradual move towards free trade, US President Donald Trump has recently shaken the foundations of the global trading system by imposing steep tariffs on imports from China and other countries.1 It is not yet clear how the US-China trade conflict will end, but there is widespread concern that an ongoing trade war between the two largest world economies may derail the recovery from the Global Crisis (Berthou et al. 2019).
To gauge the macroeconomic effects of a trade war between the US and China, we use the De Nederlandsche Bank (DNB) variant of the ECB’s multi-region, general equilibrium EAGLE (Euro Area and Global Economy) model. This model encompasses the world economy and models bilateral trade flows and their relative prices for each region explicitly. Imposing trade tariffs in the model harms world output, while causing trade diversion towards the euro area. Output in the US and China contracts as their bilateral exports drop. Instead, the euro area may benefit from an appreciated effective exchange rate that boosts private consumption.
The EAGLE model with tariffs
EAGLE is an open economy DSGE model that accounts for international macroeconomic interdependence – within the euro area, but also globally (Gomes et al. 2012). It contains four regions: the home country (in this case, the Netherlands), the rest of the euro area, the US, and the rest of the world (RoW). We take the RoW as representing China (and other non-EU targets of current US trade policy).
We extend the model to allow for import tariffs. In the model, setting a tariff on imports translates in to imposing a distortionary tax on the marginal cost of exporters. Specifically, when the US imposes tariffs on imported intermediate goods from China, it essentially imposes a tax on Chinese exporters to the US. The US fiscal authorities then collect those revenues and rebate them lump-sum to US households. A similar mechanism holds when China imposes tariffs on imported intermediate goods from the US.
Given the downward-sloping demand curve and the upward-sloping supply curve that monopolistically competitive firms face, the tax burden is shared between the (domestic) consumer and the (foreign) producer. A higher elasticity of substitution between product varieties implies less market power – then exporters bear most of the tax burden and vice versa. The model outcomes display Lerner-symmetry – import tariffs are equivalent to export taxes.2 That is, higher tariffs lead to lower imports but, equally, to lower exports. The trade balance response depends on what happens to intertemporal variables (e.g. real interest rates, and gradual changes in the real exchange rate, possibly phasing out tariffs).
Macro impact of a US-China trade war
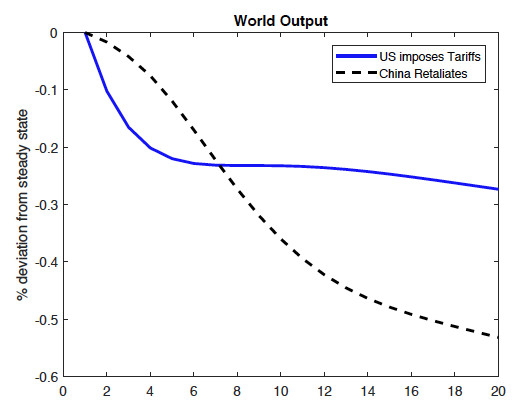
Consider a tit-for-tat US-China trade conflict where the US imposes a permanent 10% tariff on all Chinese imports. China retaliates after one quarter with a similar tariff on all US exports to China. Figure 1 shows the global impact. The US trade actions have a significantly negative impact on world output that eventually declines further once the Chinese retaliate. In the graph, one period corresponds to a quarter.
After five years, aggregate world output is over 0.5% below the baseline (‘steady state’). When China retaliates, world output falls initially less when only the US imposes tariffs. The Chinese retaliation substantially offsets the real appreciation of the dollar and there is a much stronger European increase in demand as China switches its exports from the US to the euro area. However, as relative prices adjust, the negative effects on US and Chinese investment eventually lead to lower world output after all.3
Figure 1 Effect on world output from US-China import tariffs
In Figures 2, 3, and 4, we display the responses of key macro variables in each region. Consider first US tariffs on Chinese exporters only (solid blue line). A striking result is the decline in GDP in the US itself once it imposes the tariffs on imports from China. Employment declines as tariffs also lead to lower exports from, and lower investment in, the US. Although tariffs imply a subsidy to domestic producers, they also imply a tax on all users of imported goods, an effect that worsens the impact on short-run output. Consumption in both variants declines and investment slows down, amplifying the decline in output. This is the Lerner symmetry theorem at work – import tariffs are equivalent to export taxes. A striking result is that the US tariffs initially lead to a deterioration in the US trade balance as lower output more than offsets the fall in investment and consumption.
Figure 2 Effects on US (quarters on horizontal axis)
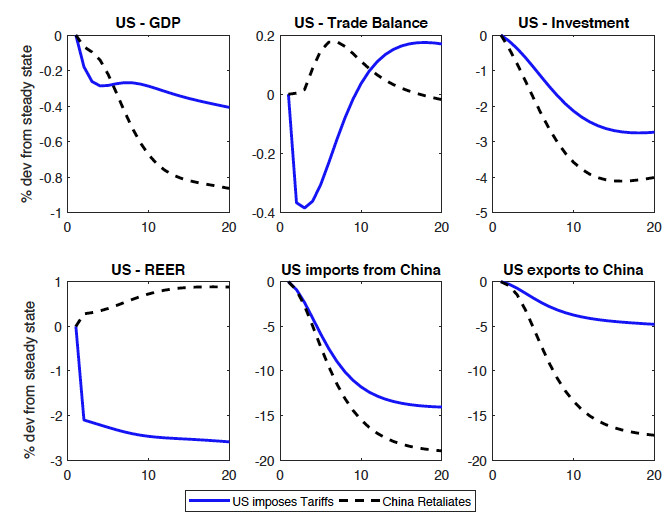
Note: The blue solid lines depict the responses when the US imposes tariffs on Chinese exporters, The black dashed lines add in China’s retaliation. A higher real effective exchange rate (REER) implies a depreciation.
Chinese retaliation (black dashed lines) adds significant injury to the US. US output contracts more, as do the other macro-indicators. China similarly sees a significant slowdown in GDP and investment.
Figure 3 Effects on China (quarters on horizontal axis)
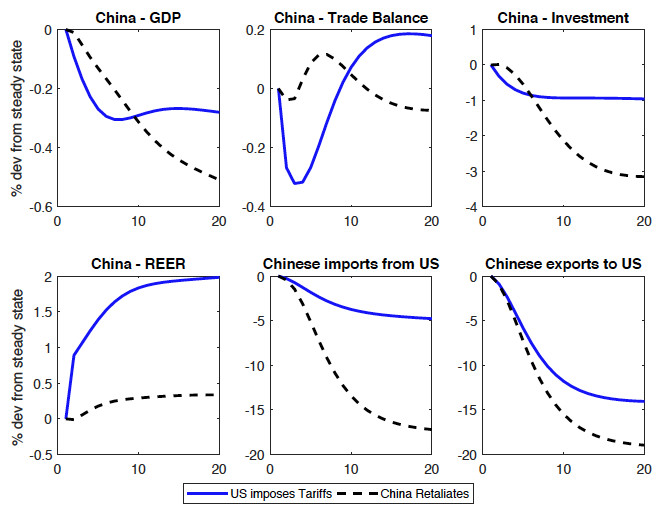
Note: The blue solid lines depict the responses when only the US imposes tariffs on Chinese exporters. The black dashed lines add in China’s retaliation. A higher real effective exchange rate (REER) implies depreciation.
The euro area has some short-run benefits though. It benefits from the trade flow effects of the trade war. Chinese exports are now diverted to the euro area at lower prices. Equally, prices of Chinese goods in the US (post-tariff) go up, which improves the euro area’s export competitiveness vis-à-vis Chinese exporters in the US. The employment across regions shows striking differences (figure 4 below) – China and the US hurt each other significantly, but European employment picks up as exports become more competitive in the US and Chinese imports become cheaper.
Figure 4 Regional employment responses (quarters on horizontal axis)
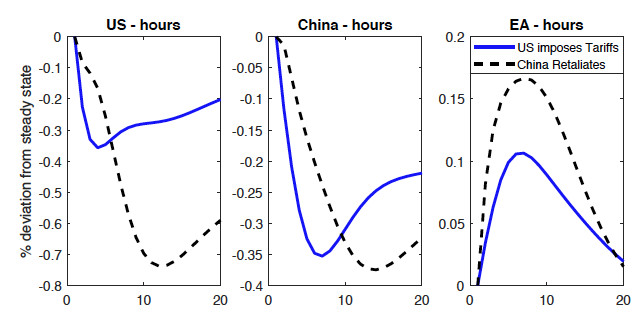
Figure 5 gives more details about the impact on Europe. The US tariffs lead to higher European exports to the US as European competitiveness against Chinese exporters improves. And imports from China increase as Chinese producers divert goods to the euro area.
Figure 5 Effects on euro area (quarters on horizontal axis)
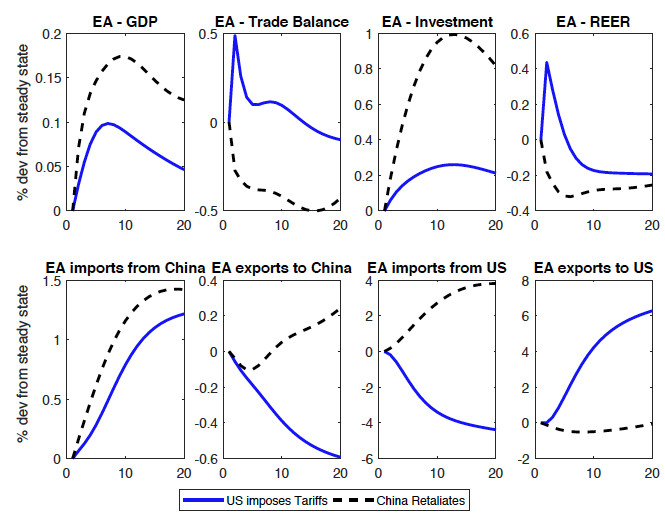
Note: The blue solid lines show the responses when only the US imposes tariffs on Chinese exporters. The black dashed lines add in China’s retaliation. An increase in the real effective exchange rate (REER) and the real exchange rate (RER) corresponds to a depreciation.
Conclusion
The analysis, stylised as it is, yields some stark conclusions. Whether tariff wars “are easy to win” we do not know, but they do inflict real harm on the US itself. Even the 10% tit-for-tat tariff war leads to almost a full percentage point lower output for several years running and a decline in consumption and investment. China experiences similar effects. In line with economic theory, the import tariff acts like an export tax – US exports decline significantly as their competitiveness is undermined by the appreciating dollar.
While two dogs (the US and China) are fighting for a bone, a third (the euro area) runs away with it. That is, the euro area may benefit from the US-China trade conflict in the short-run. The analysis suggests that as long as it does not get involved in the conflict, the euro area profits from cheaper imports from China as they get diverted from the US, and it gains improved competitiveness in the US in response to tariffs against the Chinese and the appreciating dollar. This differential impact also shows in the employment responses – down in the US and China but up in the euro area. But overall the global impact of the US trade actions is negative for world output and even more so when the Chinese retaliate.
Authors’ note: The views expressed are those of the authors and do not necessarily reflect those of the Eurosystem or De Nederlandsche Bank.
References
Berthou, A, C Jardet, D Siena, U Szczerbowicz (2019), “The macroeconomic implications of a global trade war”, VoxEU.org, 8 February.
Bolt, W, K Mavromatis, and S van Wijnbergen (2019), “The global macroeconomics of a trade war: The EAGLE model on the US-China trade conflict”, CEPR Discussion Paper no. 13495.
Erceg, C, A Prestipino, and A Raffo (2018), “The macroeconomic effects of trade policy”, International Finance Discussion Paper no. 1242.
Gomes, S, P Jacquinot, and M Pisani (2012), “The EAGLE: A model for policy analysis of macroeconomic interdependence in the euro area”, Economic Modelling 29(5): 1686-1714.
IMF, World Bank, and WTO (2017), “Making trade an engine of growth for all”, policy paper.
Linde, J, A Pescatori (2017), “The macroeconomic effects of trade tariffs: Revisiting the lerner symmetry result”, CEPR Discussion Paper no. 12534.
Ossa, R (2014), “Trade wars and trade talks with data”, American Economic Review 104(12): 4104-46.
Endnotes
[1] In a joint report with IMF and the WB, the WTO (2017) argues that trade liberalisation has brought higher productivity, greater competition, lower prices, and improved living standards.
[2] Erceg et al. (2018) and Linde and Pescatori (2017) – using a two country DSGE model – also find evidence for Lerner symmetry after tariffs are imposed.
[3] Ossa (2014) disagrees and argues there will be substantial global and individual country losses in a full-scale tariff war with retaliation.
[To read the original column, click here.]
Copyright © 2019 VoxEU. All rights reserved.
