“My objective is that before the end of the millennium Europe should have a true federation.”
Jacques Delors in 1990 (Grant 1994: 135).
The EU aims to create an integrated economic community where national borders do not impede trade in any way. Recently, Brexit and the populist governments in Italy, Poland and Hungary have challenged this.
Brexit and the rise of populism reflect a wave of anti-globalisation. These challengers are reacting to the view that national economies have become an integrated international economy (Hobolt 2016, Inglehart and Norris 2016, Sampson 2017). In this narrative, Brexit is a reaction to the large (and excessive) degree of integration achieved by the EU. In a recent paper (Comerford and Rodriguez Mora, forthcoming) we present some facts that contradict this narrative – the integration that exists within EU countries is much greater than the integration between them.
We look at the trade flows between most developed countries, including those of the EU, and measure the frictions between pairs of countries as the parameters in a standard modern trade model to explain the observed flows. In doing so, we condition on sizes, distance and common language.
We perform the same exercise with regional trade data for the UK, the US, Canada and Spain. We find that, as is well known (e.g. McCallum 1995, Anderson and van Wincoop 2003), frictions between countries are much higher than those between regions of the same country (Figure 1).
Figure 1 Trade frictions between countries and regions

Source: Comerford and Rodriguez Mora, forthcoming.
If two countries belong to the EU they have lower frictions than if at least one of them doesn’t belong, but if two regions (perhaps of the same size as the previous countries) are part of the same country, they have much lower frictions even than those EU countries. So the EU has an effect, but it is not nearly as large as the effect of being part of the same country.
A counterfactual experiment
Having established that frictions between pairs of countries are systematically higher than frictions between regions of the same country, we perform a counterfactual experiment to define the value of economic integration within a country.
In the experiment, we substitute the frictions in the data for a pair of regions with the frictions observed in the data for a suitable counterfactual country pair. Thus, for instance, considering Scotland and the rest of the UK (rUK) as a pair of regions, we observe that the country with the lowest trade frictions with the UK in the data is Ireland. The UK-Irish friction is low, but unexceptionally low by international standards.
We calibrate our model to Scotland and the rest of the UK, but then substitute the Irish-UK friction for the Scottish-rUK friction. We define the value to Scotland of economic integration within to UK as the change in Scottish GDP induced by imposing the Irish-UK friction.
With the Irish-UK friction, Scottish GDP would be 8.4% lower than it is with Scottish-rUK friction. Within-UK frictions are extremely low relative to even those of the UK with its closest international trading partners, and so the value to Scotland of economic integration in the UK is high. Therefore Scotland concentrates its trade on the rest of the UK. This is important because so much economic activity would be exposed to this change if Scotland were to become independent from the rest of the UK.
We perform the same exercise for other regions in Europe which, like Scotland, could conceivably be independent countries. We look at the value of integration within Spain for Catalonia and the Basque Country. In both cases we use Portugal as a counterfactual, as Portugal is the country with lowest measured trade frictions with Spain. The value of economic integration within a larger country in all the cases is around 10% of the region’s GDP.
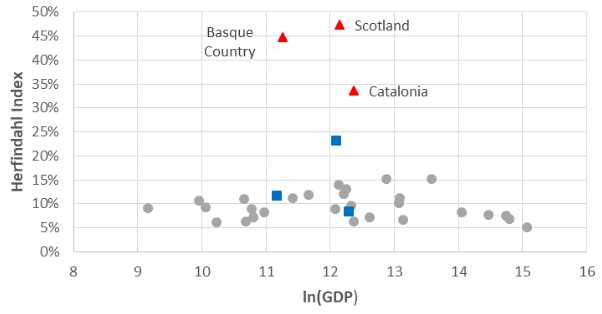
The high value of economic integration is a consequence of the degree to which these regions concentrate their trade. An extremely high proportion of their total trade is with the rest of the country of which they are currently a part. We never see concentration on this scale when looking at pairs of countries. We develop an index of trade concentration (a ‘Herfindahl Index’) which illustrates how extreme this trade concentration is within countries. Figure 2 shows this index for all the countries in our dataset, as well as for Scotland, Catalonia, and the Basque Country. We also show (in blue) the Herfindahl indices which arise from our counterfactual exercises – these are much more typical for countries.
Figure 2 Trade concentration between countries, and between regions of countries

Source: Comerford and Rodriguez Mora, forthcoming.
Once we impose a normal country friction upon the region-rest of country pair, we generate trade patterns which look typical for a country. This leads to a lower GDP, because the extremely low within-country frictions allow for massive amounts of mutually beneficial interaction which is not possible when there are country-like frictions.
Note than when performing this exercise we do not change the frictions with third parties. In the counterfactual, trade with the rest of the world increases substantially, but it cannot compensate for the loss of economic integration within the country.
Long-run trade costs of Brexit
We can use this method to measure long-run trade costs of Brexit for the UK. In this case, unlike Scotland or Catalonia, it is harder to identify a natural counterfactual for the UK outside the EU, so we suggest various possibilities.
One possibility is to compare intra- and extra-EU trade frictions as in the Scotland-Ireland exercise above, by considering examples like Switzerland or Norway (non-EU) against Austria or Sweden (EU), respectively. This results in much lower values for economic integration associated with EU membership (in the order of 1-2% of GDP).
Other possibilities are using the US, Canada, Australia or Russia (obviously, adjusting for size and distance) as possible counterfactual experiments. The results range from 1% to 3%, but are always much smaller than the value of economic integration within a country.
Note that this exercise measures the long-run value of the extra ease of trade between entities associated with a less-frictional trading configuration (such as sharing a country or both being members of the EU), relative to a more frictional trading configuration. This exercise does not capture any other economic impacts of changes in borders or memberships of organisations like the EU, such as transition costs, currency fluctuations, induced recessions or factor reallocations. In other words, we compare the long-run steady states of two possible trading configurations, which is why economic estimates of Brexit that take into account those aspects tend to produce larger costs.
Long-run trade impacts of EU collapse or integration
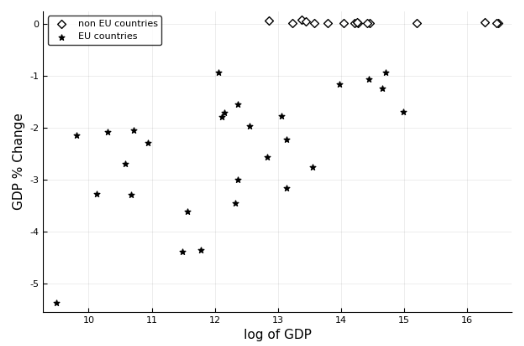
A corollary of our analysis is that we can estimate the impact if everybody leaves the EU and it falls apart. This would imply a 1.7% decrease in GDP for the countries that make up the EU. For small European countries the loss is large, close to 5% in some cases. For larger countries it is smaller (Figure 3).
Figure 3 The impact on national GDP if the EU dissolves, by country size

Source: Comerford and Rodriguez Mora, forthcoming.
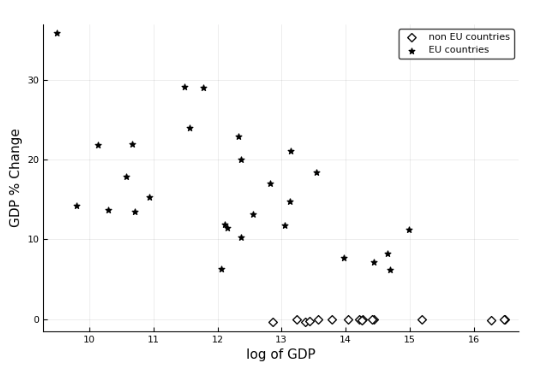
Alternatively, we can do the opposite exercise – that is, we can reduce the frictions between EU countries to the level where they appear like frictions within a country (controlling for distance and size as before). The result is an increase in EU GDP of 10.9%. Again, for small European countries the gain is extremely large, while for larger countries it is smaller.
Figure 4 The impact on national GDP if there were a ‘United States of Europe’, by country size

Source: Comerford and Rodriguez Mora, forthcoming.
Pessimistic and optimistic interpretations
There are two ways of looking at these results:
- A pessimistic interpretation. If the objective of the EU is to facilitate exchange and interactions across countries with the same ease and freedom as within countries, then it is clearly failing; compare the value of integration within a country (of the order of 10% of GDP) to the value of integration within the EU (of the order of 1%).
- An optimistic interpretation. The EU has made the idea of a war in Europe inconceivable (for the first time in history), and it has fostered cooperation between governments and government agencies beyond what was even remotely plausible a generation ago. There is still a long way to go to reach full economic integration, a ‘United States of Europe’. The gains that can be achieved by this integration would be an order of magnitude greater than the gains achieved so far.
References
Anderson, J, and E van Wincoop (2003), “Gravity with Gravitas: A Solution to the Border Puzzle”, American Economic Review 93(1): 170-92.
Comerford, D, and J V Rodriguez Mora (forthcoming), “The gains from economic integration”, Economic Policy.
Grant, C (1994), Delors – Inside the House that Jacques Built, Nicholas Brearley.
Hobolt, S B (2016), “The Brexit vote: a divided nation, a divided continent”, Journal of European Public Policy 23: 1259-77.
Inglehart, R F, and P Norris (2016), “Trump, Brexit, and the Rise of Populism: Economic Have-Nots and Cultural Backlash”, HKS working paper RWP16-026.
McCallum, J (1995), “National borders matter: Canada-U.S. regional trade patterns”, American Economic Review 85(3): 615-23.
Sampson, T (2017), “Brexit: The Economics of International Disintegration”, Journal of Economic Perspectives 31(4): 160-84.
To view the original paper, please click here.
Copyright © Center for Economic and Policy Research. All Rights Reserved.
