In our original Vox column from 28 November 2017 (see below), we estimated the output costs of the Brexit vote that had already materialised since the June 2016 referendum. Our new estimate uses the latest OECD data to update and extend the estimates to mid-2018.
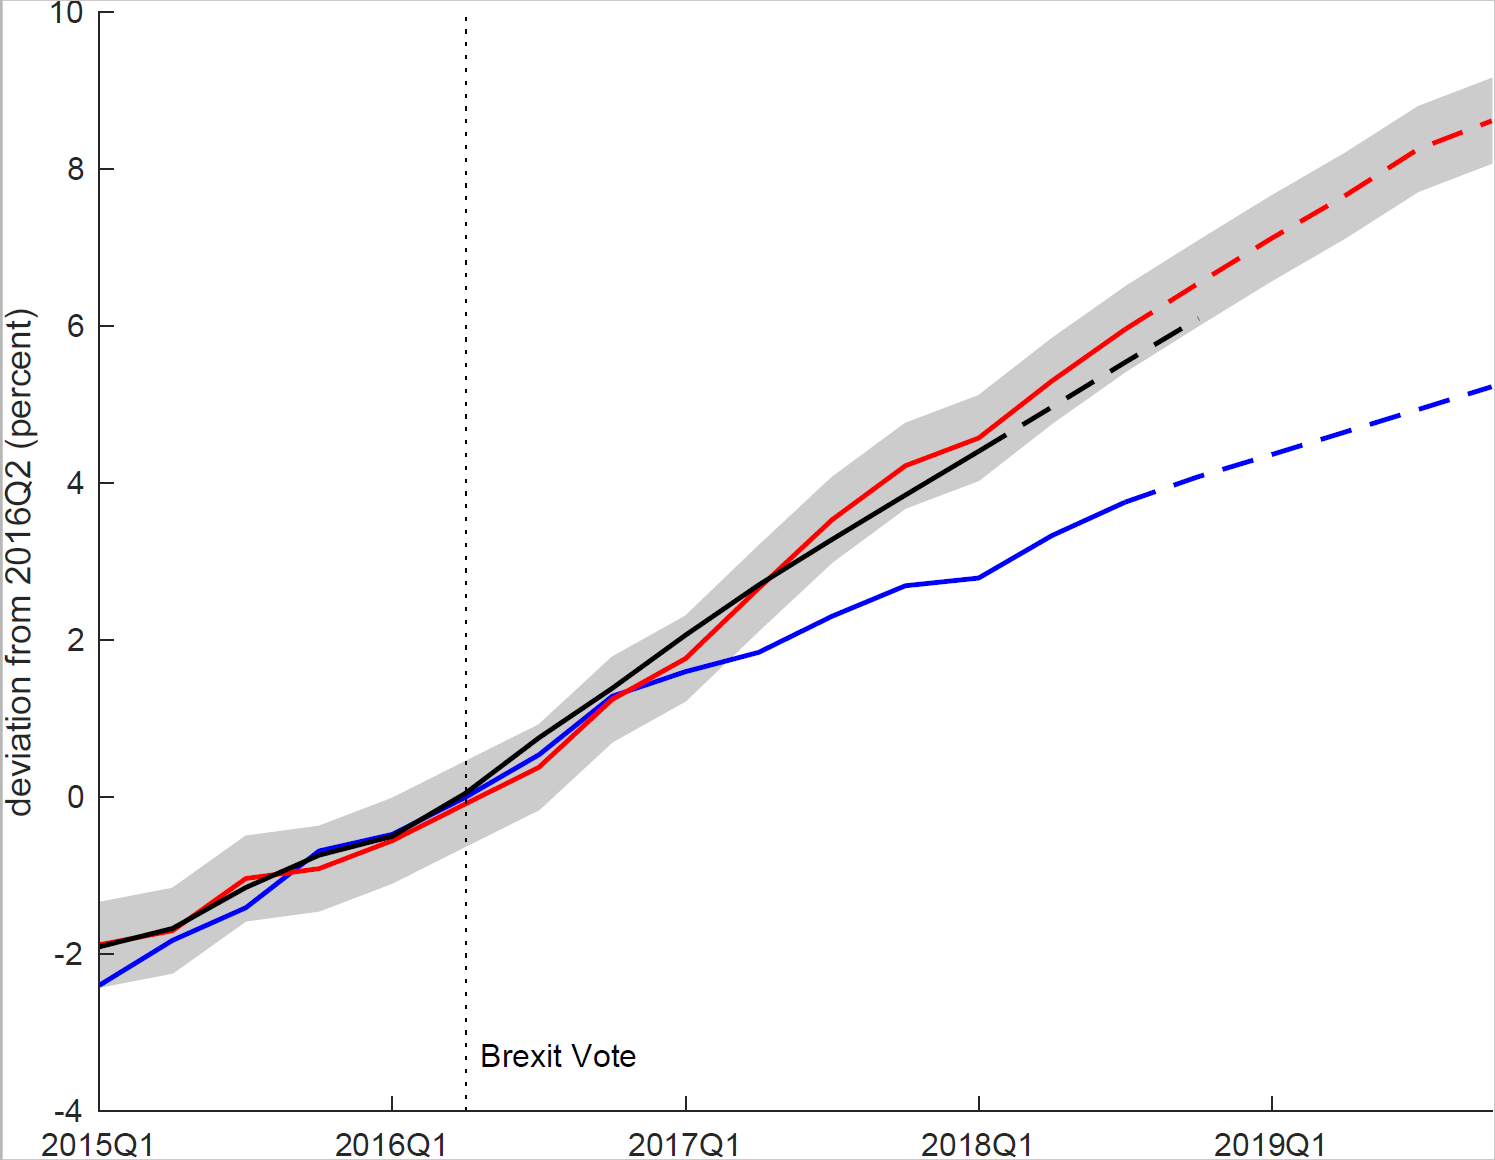
We now estimate that the output loss due to the Brexit vote amounts to about 2% of GDP, or £35 billion. The negative drag from the Brexit vote has increased somewhat since our last estimation and now amounts to roughly £350 million a week. Under current OECD forecast, we expect the output loss to increase to 3.4% of GDP by end-2019.
The figure below compares actual output in the UK (blue) to the counterfactual UK economy that could have been expected otherwise (the “doppelganger”). The originally estimated doppelganger (black) is constructed using data from November 2017, while the latest doppelganger is based on the most recent data (red). As before, dashed lines indicate forecasts and the shaded area corresponds to one standard deviation of the pre-Brexit vote difference between the UK and its doppelganger.
Start of original column (published 27 November 2018)
There is huge variation in the estimated cost of Brexit. Most studies forecast that a reduction in trade or a fall in foreign direct investment (FDI) – or both – will reduce output. For instance, HM Treasury (2016) uses a gravity model to assess the economic impact in several scenarios, and concludes that losses could be up to 6% of GDP in the long term. Yet the future relationship between the UK and the EU is highly uncertain (Baldwin 2016). As a result, estimating the cost of Brexit is difficult. Different assumptions about the deal that the UK will lead to different cost estimates.
That’s why we take a different approach in a recent paper (Born et al. 2017). Rather than making set of assumptions which are bound to be controversial, and using them to forecast the economic costs of Brexit, we measure the actual output loss from the UK’s decision to leave the EU. Our approach does not depend on having the right model for the British, the European, or even the global economy. We do not assume a particular Brexit deal, or construct specific scenarios for the outcome of the negotiations. Instead we create a transparent, unbiased, and entirely-data driven ‘Brexit cost tracker’ that relies on synthetic control methods (Abadie and Gardeazabal 2003).
What if the referendum had never happened?
Finding an appropriate counterfactual is a daunting task when the treated unit is a whole country (in this case, the UK). In the public debate, one common practice is to informally pick another country with a similar economic structure and compare outcomes. For instance, one could compare the performance of the UK economy since the referendum to European countries such as Germany, or to the US or Canada. Yet clearly this is unsatisfactory. How can we know which countries to compare? Was their growth path pre-intervention really similar to that of the UK?
Our approach to determining the costs of the Brexit vote uses the same intuitive idea, but it formalises the approach in a statistical sense. We let an algorithm determine which combination of other economies matched the evolution of real GDP in the UK before the Brexit vote with highest possible accuracy. We use the period between Q1 of 1995 and the Brexit vote in Q2 of 2016. For this purpose, we consider indices of real GDP for 30 OECD countries, normalised to unity in 1995.
The algorithm choses the economies and weights assigned, not researchers. The better the algorithm-driven economic doppelganger for the UK economy as a weighted combination of other OECD economies, the more accurate our results are. For the UK, our matching algorithm attributes high weights to Canada and the US, but also to Japan and Hungary. These weights are open to replication by other researchers.
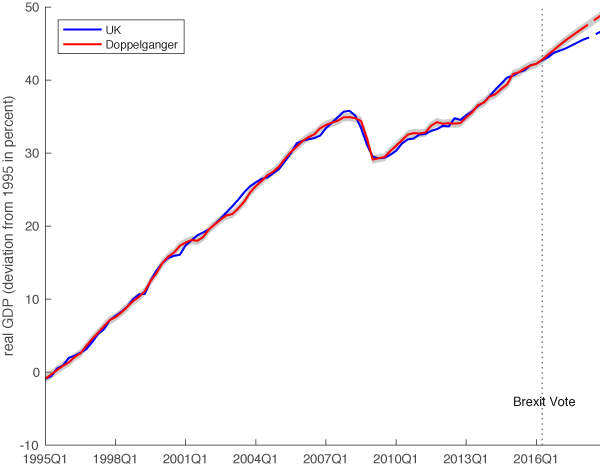
Figure 1 shows that our synthetic UK economy (red line) tracks the evolution of the UK (blue line) very closely before the referendum. The doppelganger had the same trend growth of the UK and exhibited very similar short-run fluctuations. For instance, it matches the fall in output during the Great Recession, and the subsequent recovery.
Figure 1 UK (blue line) versus doppelganger (red line)
To read the full report posted by VOX EU, click here.