Tariff hikes, tariff threats, and tariff retaliations have become a major source of economic uncertainty, stock market volatility and concerns about the global outlook (e.g. Blanchard 2019, Crowley 2019, Evenett and Fritz 2019, Fajgelbaum et al. 2019, Jacks and Novy 2019). This column draws on three initiatives that aim to quantify the rise in trade policy uncertainty and its role in stock market volatility.
Measures of policy uncertainty
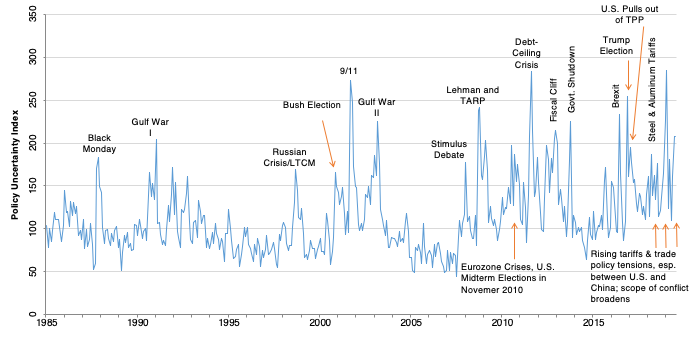
Figure 1 shows our overall index of economic policy uncertainty (EPU) for the US. It captures uncertainty over what economic policy actions will be taken and when, who will make or implement the policies, and what will be their economic effects. The index reflects the frequency of articles in ten major US newspapers that contain at least one term in each of the following sets: “economic” or “economy”; “uncertain” or “uncertainty”; and one or more of “congress,” “deficit,” “Federal Reserve,” “legislation,” “regulation” or “White House.”
Figure 1 US economic policy uncertainty index, 1985 to July 2019

Note: Monthly data normalised to 100 from 1985 to 2009.
Source: Baker et al. (2016), as updated at www.policyuncertainty.com.
The US EPU index has fluctuated at elevated levels since the Global Crisis. However, the sources of high policy uncertainty shifted over time – from US and European policy responses to the crisis, to fights over US fiscal policy in the 2011-2013 period, and to Brexit and the US elections in 2016. More recently, prominent moves in the US EPU reflect news about trade agreements, tariffs, threats, and trade negotiations.
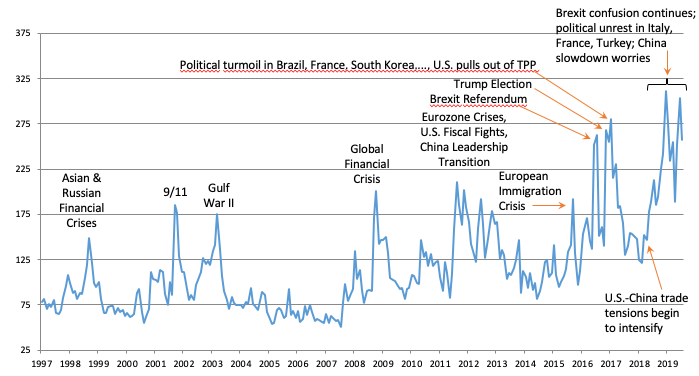
Figure 2 shows our global EPU index, computed as a GDP-weighted average of national EPU indices for 21 countries that account for 80% of global output. High economic policy uncertainty is even more pronounced at the global level, with the global EPU index reaching several all-time highs since 2016.
Figure 2 Global economic policy uncertainty index, January 1997 to July 2019

Notes: Using data for 21 countries that account for 80% of global GDP at current prices. Normalised to 100 from 1997 to 2015.
Sources: Baker et al. (2016), Davis (2016) and PolicyUncertainty.com.
Many of these peaks are direct responses to trade policy developments – the US withdrawal from the Trans-Pacific Partnership (TPP) in January 2017, tariff hikes on US steel and aluminium imports in March 2018, ongoing Brexit uncertainty, and escalating US-China trade tensions. China, the country most heavily targeted by US tariff hikes and President Trump’s harsh trade rhetoric, has experienced a dramatic rise in overall policy uncertainty and in trade policy uncertainty since 2017.1
While trade concerns are not the only forces in play, the US-China trade relationship has clearly become more uncertain and protectionist. The trade-weighted average US tariff on Chinese imports rose from 3.1% in 2017 to 18.3% in May 2019 (Brown and Zhang 2019). Current US plans will take the average US tariff on Chinese imports above 24% as of 15 December 2019 (Brown 2019). China has responded, raising its average tariff on US exports from 8.0% at the beginning of 2018 to 16.5% in June 2018 and an estimated 25.9% on 15 December 2019 (Brown 2019).
Looking across all countries, the trade-weighted average US tariff rate rose from less than 2% in December 2017 to 4% in May 2019. It is slated to reach an estimated 5-8% by the end of 2019.2 Other countries have retaliated, raising trade barriers to US exports.
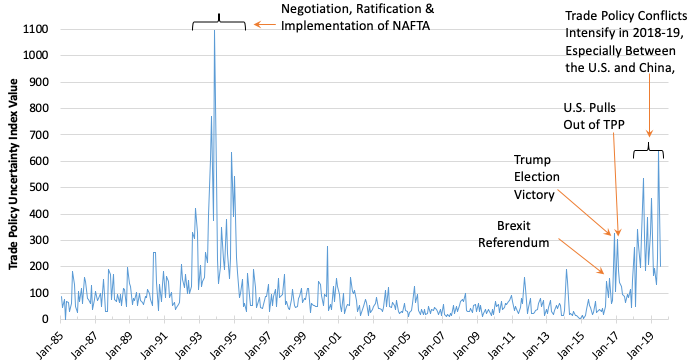
These and related developments drove a tremendous upsurge in anxiety and uncertainty about trade policy and its economic fallout. To attach some numbers to this point, Figure 3 displays our newspaper-based index of trade policy uncertainty (TPU) for the US, which reflects the frequency of articles in US newspapers that discuss economic policy uncertainty and trade policy matters. It is scaled to a mean value of 100 from 1985 to 2009.
Figure 3 US trade policy uncertainty index, January 1985 to July 2019

Note: Monthly data normalised to 100 from 1985 to 2009.
Source: Baker et al. (2016), as updated at www.policyuncertainty.com.
Two periods stand out in Figure 3. The first runs from August 1992 to March 1995 and reflects uncertainties around the negotiation, ratification and implementation of the North American Free Trade Agreement (NAFTA). The second commences with Donald Trump’s election victory in November 2016. The TPU index rose above 300 in reaction to the election outcome, the US withdrawal from the TPP in January 2017, and US tariffs on steel and aluminium imports in March 2018. It rose even higher later in 2018 and in 2019, as US-China trade policy conflicts intensified. The TPU index value averages 301 from March 2018 to July 2019 – 7.7 times its average from 2013 to 2015 and 5.3 times its average from 1996 to 2015.3
Newspaper-based TPU indices for Japan (Arbatli et al. 2019) and China (Davis et al. 2019) also exhibit dramatic increases since 2017. Evidently, President Trump’s protectionist policies, threats, and bellicose rhetoric have brought about an extraordinary rise in trade policy uncertainty inside and outside the US.
Trade policy uncertainty and stock market volatility
The effects of trade policy uncertainty are highly visible in equity markets. In Baker et al. (2019b), we examine the role of trade policy developments and 15 other news categories in large daily stock market moves. We first identify every day since 1900 in which the US market moves by more than 2.5%, a total of 1,116 days. For each daily stock-market jump, we then read the following day’s Wall Street Journal account to classify the perceived trigger of the market jump.
Table 1 shows a data cut that highlights an unprecedented rise in trade policy news as a source of large stock market moves. There have been only 13 jumps in 2018 and 2019, but next-day accounts in the WSJ attribute five of them (38.5%) mainly to trade policy news. Over the previous 118 years, next-day accounts attribute only seven of 1,103 (0.6%) daily stock market jumps mainly to news about trade policy. In a rather discomforting parallel, all but one of the trade-policy jumps from 1900 to 2017 occurred in the 1930s.
Table 1 Trade policy jolted the US stock market in 2018 and 2019

Note: This table is a tabulation of results in Baker et al. (2019b), who consider all daily jumps in the US stock market greater than 2.5%, up or down, since 1900. They classify the reason for each jump into 16 categories based on human readings of next-day (or same evening) accounts in the Wall Street Journal. The table reports the number of jumps and the number attributed primarily to news about trade policy. The five jump dates in the recent period attributed primarily to trade policy, and the corresponding value-weighted returns on the S&P 500, are 22 March 2018, -2.52%; 26 March 2018, 2.72%; 4 December 2018, -3.24%; 5 August 2019, -2.98%; and 23 August 2019, -2.59. All but one of the earlier jumps attributed primarily to trade policy occurred in the 1930s.
The role of trade policy as a source of recent financial market moves extends to individual firms. For instance, Huang et al. (2018) examine firm-level stock and bond returns during short windows around 22 March 2019, when the Trump administration issued a presidential memorandum proposing new tariffs on $50 of Chinese imports. This date is the first of the aggregate stock market jumps triggered by trade policy news in the bottom row of Table 1. The authors find larger negative stock and bond returns for US firms with greater exposure to trade with China around this event and larger negative returns for Chinese-listed firms with greater sales to the US.
The impact of trade policy on financial markets also extends beyond a few large events and Trump tweets. In a separate analysis, we consider the broader role of trade policy news as a source of equity market volatility. In Baker et al. (2019a), we first use automated methods to identify articles about stock market volatility in 11 leading US newspapers and to construct an equity market volatility (EMV) tracker. Our EMV tracker performs well in the sense that it moves closely with option-implied and realised stock market volatility. Parsing the text in the EMV articles, we then quantify journalist perceptions of what drives volatility in equity returns and classify the drivers into about thirty categories, one of which pertains to trade policy. This approach lets us assess the importance of each category to the average level of stock market volatility and its movements over time.
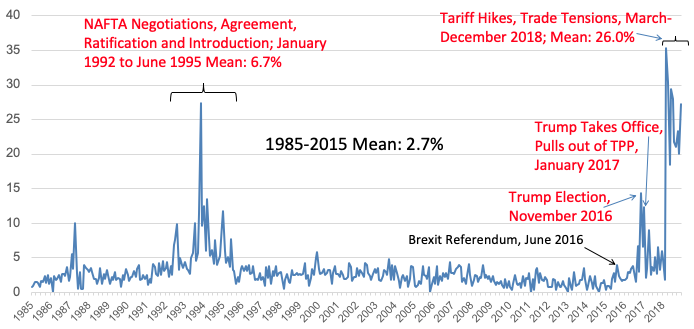
Figure 4 highlights the role of trade policy in stock-market volatility under this approach. From 1985-2015, a period encompassing important trade agreements, trade policy matters receive attention in less than 3% of newspaper articles about equity market volatility. This share rose above 10% in reaction to Donald Trump’s election victory and again when the US pulled out of the TPP, before settling to temporarily lower levels. It skyrocketed in March 2018 when the US hiked steel and aluminium tariffs and President Trump issued his memorandum about new tariffs on Chinese imports. From March to December 2018, trade policy is discussed in more than a quarter of newspaper articles about stock market volatility.
Figure 4 Percent of articles about equity market volatility in leading US newspapers that discuss trade policy matters, 1985 to 2018

Note: Computed from automated readings of newspaper articles about Equity Market Volatility and (Equity Market Volatility + Trade Policy) in 11 major U.S. newspapers.
Source: Baker et al. (2019a).
In the course of a few months, trade policy went from a relative afterthought in financial markets to perhaps the most pressing question affecting financial investments and corporate strategy around the globe.
Concluding remarks
The recent rise in trade policy uncertainty is extraordinary by several metrics. While not the subject of this article, much evidence points to negative effects of trade policy uncertainty on firm-level and macroeconomic performance.4 Given the strength of populist political forces on the left and right, and their antipathy toward international trade and globalization, we fear that high trade policy uncertainty will be a prominent feature of the economic landscape for many years. In short, the recent rise in trade policy uncertainty threatens to become the new normal.
References
Arbatli, E, S J Davis, A Ito, and N Miake (2019), “Policy Uncertainty in Japan,” NBER working paper no. 23411, revised.
Baker, S, N Bloom and S J Davis (2016), “Measuring Economic Policy Uncertainty,” Quarterly Journal of Economics, November.
Baker, S, N Bloom, S J.Davis and K Kost (2019a), “Policy News and Stock Market Volatility,” NBER working paper no. 25720.
Baker, S, N Bloom, S J Davis and M Sammon (2019b), “What Triggers Stock Market Jumps?” working paper.
Bertou, A, C Jardet, D Siena and U Szczerbowicz (2019), “The Macroeconomic Implications of a Global Trade War,” VoxEU.org, 8 February
Blanchard, E (2019), “Trade Wars in the Global Value Chain,” VoxEU.org, 20 June.
Bloom, N (2014), “Fluctuations in Uncertainty,” Journal of Economic Perspectives 28(2): 153-176.
Brown, C P (2019), “U.S.-China Trade War: The Guns of August,” Peterson Institute, 26 August.
Brown, C P and E Y Zhang (2019), “Trump’s Latest Trade War Escalation Will Push Average Tariffs Above 20 Percent,” Peterson Institute, 6 August.
Caldara, D, M Iacoviello, P Molligo, A Prestipino and A Raffo (2019), “The Economic Effects of Trade Policy Uncertainty,” presented at the SITE conference on the “Macroeconomics of Uncertainty and Volatility”, August.
Crowley, M A (2019), “Trade War: The Clash of Economic Systems Threatening Global Prosperity: A New E-Book,” VoxEU.org, 30 May.
Davis, S J (2019), “Rising Policy Uncertainty,” BFI Working Paper, 28 August.
Davis, S J, D Liu and X S Sheng (2019), “Economic Policy Uncertainty Since China: The View from Mainland Newspapers,” presented at the SITE conference on the “Macroeconomics of Uncertainty and Volatility”, August.
Evenett, S and J Fritz (2019), “Misdirection and the Trade War Malediction of 2018: Scaling the U.S.-China Bilateral Tariff Hikes,” VoxEU.org, 1 July.
Fajgelbaum, P, P Goldberg, P Kennedy and A Khandelwal (2019), “The Return to Protectionism,” VoxEU.org, 12 April.
Jacks, D and D Novy (2019), “Trade Wars May ‘Bloc Up’ World Trade,” VoxEU.org, 23 July.
Endnotes
[1] We see a sharp rise in the China EPU index constructed by Baker et al. (2016) using the South China Morning Post, Hong Kong’s leading English-language newspaper, and the one by Davis et al. (2019) based on leading mainland Chinese newspapers. Davis et al. also construct a trade policy uncertainty index for China. These indices are available at http://www.policyuncertainty.com/china_epu.html.
[2] These figures for the end of 2019 are a composite of estimates attributed to Deutsche Bank and UBS Group in “Costly Tariff Spat Masks Deeper Trade Problems,” Wall Street Journal, 18 August 2019 and a chart attributed to Oxford Economics in “The Daily Shot: How High Will the Average U.S. Tariff Rate Get?” Wall Street Journal, 7 June 2019.
[3] Based on transcripts of corporate earnings conference calls, Caldara et al. (2019) find an equally dramatic rise in their TPU index since 2017 – one that is larger relative to what they find for the NAFT increase.
[4] See Bloom (2014) and Davis (2019) for discussions of how uncertainty affects economic performance and extensive references to the literature.
The extraordinary rise in trade policy uncertainty _ VOX, CEPR Policy Portal
To read the original research: click here
