With the well-publicised recent hikes in US import tariffs, and the imposition of retaliatory tariffs by its trade partners, it appears that trade policy is back. But did it ever really go away?
There is strong evidence that it did not. Although multilateral trade agreements had pushed countries’ import tariffs to ever lower levels over the last several decades, governments had been imposing other constraints on imports even before the most recent trade wars. A prominent example is provided by temporary import barriers such as antidumping and countervailing duties. According to Vandenbussche and Zanardi (2010), the number of countries with antidumping laws rose steeply in the second half of the 20th century, and for intensive users of antidumping duties, such as India and Mexico, these measures have had a large negative impact on aggregate imports. Moreover, Bown and Crowley (2013, 2014) find that they have been applied in a systematic way: countries become more likely to impose such restrictions after a negative macroeconomic shock.
These measures have also been more frequently used when a country’s multilateral commitments have imposed restrictions on its import tariffs for a wider range of products (Bown and Crowley 2014). Similarly, Limão and Tovar (2011) show that Turkey has been more likely to impose a requirement that a product must be authorised for import if it has committed to keep that product’s import tariff at a lower level. So it seems that when one type of import barrier has become less readily available, others have been more likely to emerge.
What about other forms of trade policy? In principle, the instruments of trade policy include not only restrictions on imports, but also many other types of measures, such as subsidies, domestic content requirements and discriminatory tax treatment. Such instruments are certainly used in practice: measures other than import restrictions have been the subject of a large number of disputes adjudicated by the WTO over the last 25 years. But have these other measures been applied systematically? And how do they compare to the schedules of import tariffs that countries once applied when unconstrained by trade agreements?
Unfortunately, a full assessment of such policies is not feasible. While import tariffs are published by governments worldwide in publicly available catalogues, instruments such as subsidies do not receive the same treatment. However, in a recent paper (Garred 2018), I carefully examine one set of trade policy instruments for which comprehensive and readily quantifiable data are available: export restrictions in China. I create a full catalogue of China’s product-level export restrictions in the years immediately before and after its 2001 accession to the WTO. I then compare post-accession changes in China’s export policies to its pre-accession import tariff schedule.
The most important of these export restrictions is China’s incomplete rebates of value-added tax (VAT) to exporters. Most countries charge VAT at the local rate on all imports, while rebating any VAT paid by domestic firms on products that they export. This system ensures that the same VAT rate is charged on all goods sold in a market (whether they are imported or domestically produced), preventing internationally traded products from being double-taxed.
However, in China, the official VAT rebate rates for exporters vary by product, and are often lower than the local VAT rate (which, during the period studied, was 17% for most non-agricultural goods). Because Chinese exports are disadvantaged in their destination markets if VAT is not fully rebated to exporters, this policy is actually a tax on exports – the smaller the rebate rate, the larger the export tax (Feldstein and Krugman 1990).
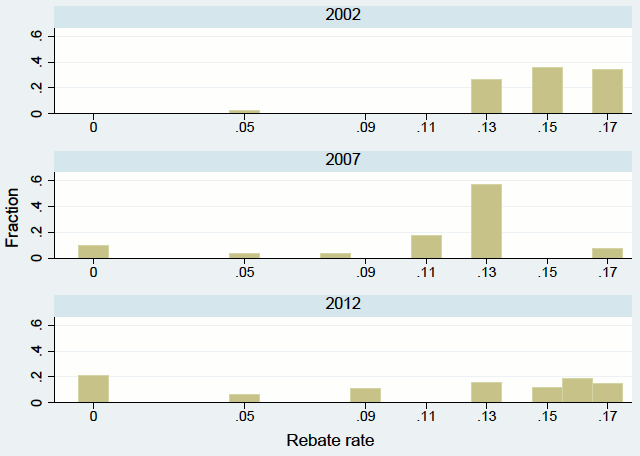
Figure 1 displays the distribution of China’s export VAT rebate rates across non-agricultural products in 2002, 2007 and 2012.1 This shows that different Chinese goods may receive substantially different treatment, and that the size of these differences in rebate rates grew after 2002. By 2012, a significant fraction of products – around 20% – were not eligible to receive any rebate of VAT paid.
Figure 1 Distribution of China’s export VAT rebate rates across products

Notes: ‘Fraction’ represents the fraction of products assigned a particular official rebate rate in the given year. Rebate rates are defined in proportional terms; e.g. a rebate rate of 0.17 implies a full rebate of China’s 17% VAT. Products are defined according to the six-digit Harmonized System classification and include non-agricultural goods only.
Because VAT rebate rates for exporters are never negative, the export tax imposed through this policy instrument can effectively be no larger than the rate of VAT (i.e. 17%). But starting in 2005, China also began directly imposing export duties on a growing range of products. By 2012, these duties were imposed exclusively on goods whose export VAT rebate rates were zero; i.e. products whose export taxes due to China’s VAT rebate policy were at the maximum possible level. This further increased the differences in export tax treatment between different Chinese goods.2
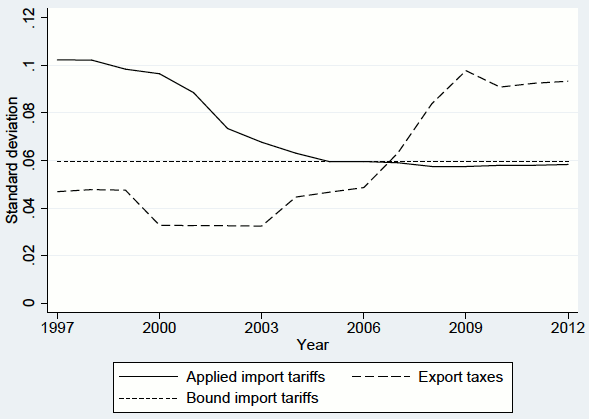
The year-to-year evolution in these differences can be seen in Figure 2, which plots the rising standard deviation across products of the export tax equivalent of these two policies (considered together). The figure shows that this increase in export tax variation began soon after China’s 2001 accession to the WTO and continued for several years afterwards.
Figure 2 Variation across products in China’s import tariffs and export taxes

Notes: ‘Standard deviation’ represents the standard deviation across products of import tariffs (or export taxes) in a particular year. ‘Applied import tariffs’ are the tariffs listed in China’s official tariff schedule. ‘Bound import tariffs’ are the final maximum rates for China’s tariffs set as a condition of its WTO accession. ‘Export taxes’ are calculated as the export tax equivalent of China’s export VAT rebate policies and export duties. Products are defined according to the six-digit Harmonized System classification and include non-agricultural goods only.
Figure 2 also displays the contemporaneous changes in variation in Chinese import tariffs. Starting in 2000, China was required to gradually cut its actual (‘applied’) tariff rates to levels at or below the (‘bound’) maximum rates negotiated, product by product, as a condition of its WTO accession. Since products with initially higher tariffs tended to see larger reductions, differences in import tariffs across goods narrowed as a consequence. Figure 2 therefore documents two opposing trends: the compression in variation in Chinese import tariffs due to its WTO accession commitments, followed by a change in export tax variation in the opposite direction.
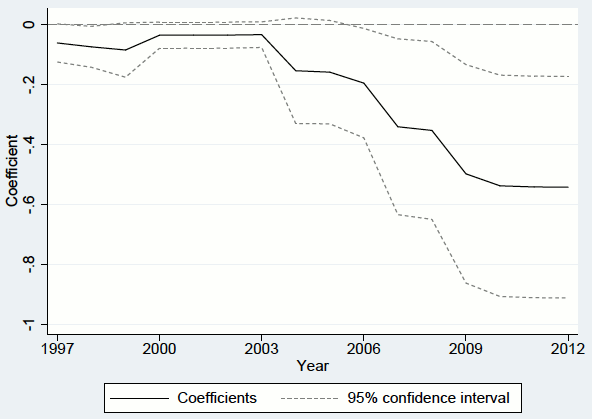
So when China joined the WTO, Chinese industries with especially high tariff barriers (such as the automotive sector) and especially low tariff barriers (such as the mining sector) saw their tariff levels become much closer together. Did China’s subsequent changes in export policies differently affect the industries whose import tariffs were initially highest? The final year in which China’s non-agricultural import tariffs were set unilaterally by the Chinese government (rather than by multilateral negotiations) was 1999. So in Figure 3, I compare China’s export tax schedule in each year from 1997 to 2012 to its 1999 schedule of tariffs.
Figure 3 Relationship between China’s export taxes and 1999 import tariffs

Notes: The figure is based on a set of 16 simple linear regressions (one for each year), each with the average export tax on products of a given industry in that year as the dependent variable and the average import tariff on products from the same industry in 1999 as the independent variable. ‘Coefficient’ is the estimated coefficient on the independent variable, and its 95% confidence interval is represented by the dotted lines. Industries are defined according to the four-digit Chinese industrial classification and include non-agricultural sectors only.
Before China’s accession to the WTO, there was no correlation between China’s export taxes and its import tariffs; in other words, industries for which imports were more restricted in 1999 had neither especially high nor especially low export taxes. By 2012, however, a systematic relationship had emerged: an industry whose 1999 tariff was one percentage point larger was now subject to a one-half percentage point smaller export tax on average. This means that the industries lying behind higher tariff barriers in 1999 were given lower export taxes in 2012.
This correlation is mainly due to the fact that the sectors with the largest pre-WTO tariffs were producers of goods relatively downstream in the value chain, while subsequent export tax rises were concentrated in raw materials industries. Because an export tax can push a product’s domestic price below its world price, downstream sectors can gain an input cost advantage over foreign competitors if locally produced raw materials are subject to export taxes. Indeed, the issue of China’s upstream export taxes advantaging its downstream producers has been the focus of two cases brought to the WTO’s dispute settlement mechanism by the US and EU.3
So, like other countries participating in the multilateral trading system, China agreed to limit the use of import tariffs when it joined the WTO. But it continued to employ other instruments of trade policy, including a new set of restrictions on exports. Moreover, these export restrictions partly restored the asymmetric treatment of Chinese industries embodied in its pre-WTO import tariffs.
While China’s export policies make for a striking case study of the persistence of trade policy beyond import tariffs, this is not only a Chinese phenomenon. As discussed above, researchers have shown that even while the use of import tariffs was falling, other types of trade policy instruments grew in importance in countries around the world. Seen from this perspective, today’s tariff wars are just the latest example of an ongoing battle whose skirmishes have taken many forms.
References
Bown, C P and M A Crowley (2013), “Import Protection, Business Cycles, and Exchange Rates: Evidence from the Great Recession”, Journal of International Economics 90(1): 50-64.
Bown, C P and M A Crowley (2014), “Emerging Economies, Trade Policy, and Macroeconomic Shocks”, Journal of Development Economics 111: 261-273.
Branstetter, L and N Lardy (2008). “China’s Embrace of Globalization”, in L Brandt and T G Rawski (eds), China’s Great Economic Transformation, Cambridge University Press, pp. 633-682.
Feldstein, M S and P R Krugman (1990), “International Trade Effects of Value-Added Taxation”, in A Razin and J Slemrod (eds), Taxation in the Global Economy, University of Chicago Press, pp. 263-282.
Garred, J (2018). “The Persistence of Trade Policy in China After WTO Accession”, Journal of International Economics 114: 130-142.
Limão, N and P Tovar (2011). “Policy Choice: Theory and Evidence from Commitment via International Trade Agreements”, Journal of International Economics 85(2): 186-205.
Vandenbussche, H and M Zanardi (2010), “The Chilling Trade Effects of Antidumping Proliferation”, European Economic Review 54(6): 760-777.
WTO (2011), China – Measures Related to the Exportation of Various Raw Materials: Reports of the Panel.
Endnotes
[1] I focus on non-agricultural goods to simplify interpretation of the relationship between China’s export and import policies. This is because liberalization of trade in Chinese agricultural products, where nontariff barriers to imports were particularly important, often involved the replacement of these nontariff barriers with tariffs, rather than tariff cuts (Branstetter and Lardy 2008). The results discussed here are somewhat weaker but not qualitatively different when agricultural goods are included.
[2] These policies do not apply to certain types of ‘processing trade’, where inputs from abroad may be imported duty-free, processed and then re-exported, again duty-free. This might have left the door open for firms affected by export taxes to move into this alternative trade channel. However, from 2004 onwards, China significantly expanded the list of products prohibited from export via processing trade, and the goods added to this list tended to be the products facing the fastest-growing export taxes.
[3] A US government submission to one of these disputes argued that “China’s industrial strategy is to leverage and exploit the differences in the international and domestic markets for raw materials and downstream, processed products, using restraints on exports as the linchpin” (WTO 2011). The two cases targeted China’s export duties on certain raw materials, as well as a set of export license requirements and export quotas, but did not attempt to change China’s export VAT rebate policies. Both WTO panels ruled that the policies identified by the complainants were inconsistent with China’s WTO accession commitments.
[To view the original column, click here.]
Copyright© 2019 VoxEU. All rights reserved.
